
My day job is currently with a title company and we send our customers lists several times a week of for sale by owner lists and foreclosure lists. These typically come in a CSV (Excel-readable) file format. I’m the lucky one to generate these TPS reports and when I look at them, I think, “Drat! If only these spreadsheets weren’t so ugly and non user friendly and organized in a way that made sense. Maybe if I could easily see these FSBO’s on a map or show an investor where the foreclosures are so we don’t waste gas driving around aimlessly!” Okay, fine, I don’t say “Drat”.
Mapalist to the Rescue!
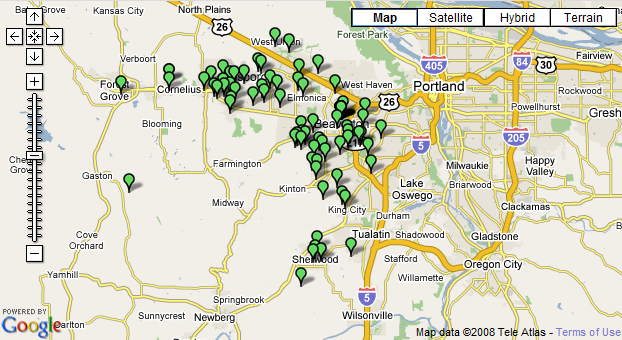
I’ll forewarn you, they just got some great publicity, so the site is taking a little bit of a hit at the moment. But basically, you put your addresses into a Google Docs spreadsheet (you know how to copy and paste, right?) Below is a map of all of the homes in various states of foreclosure in my county. Click on the map to see all of the details. Depressing, yet easy to look at!
It’s SO Easy
It literally took me less than 5 minutes to find the report on our terribly disorganized corporate share drive, copy the data to Google Docs, wait for Mapalist to load, register and go through the whole process. So simple! Now I can plan my driving route, see which neighborhoods are busiest, plan my stops during the weekly brokers tour or just look at a pretty map.
What uses can you imagine for this tool in your real estate business?