Rise of the visualizations
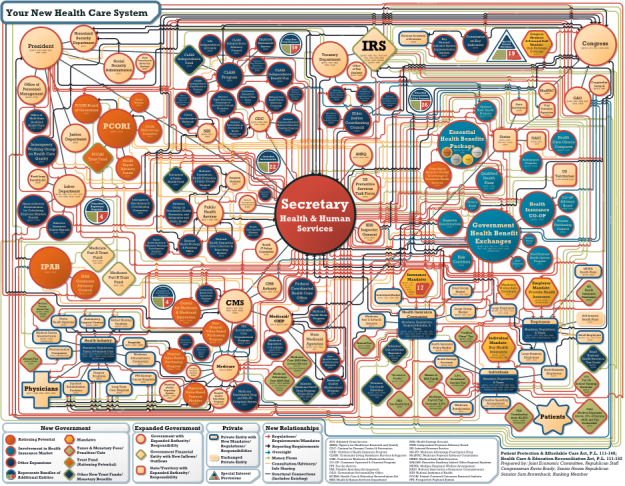
Businesses of all sizes are taking advantage of the increasingly available web tools to better present information visually, be it at a company meeting or in presenting services and products to a client, and there is no shortage of infographics these days. But because the trend for the past few years has been toward visualizing any information possible, you end up with infographics that are more like this:

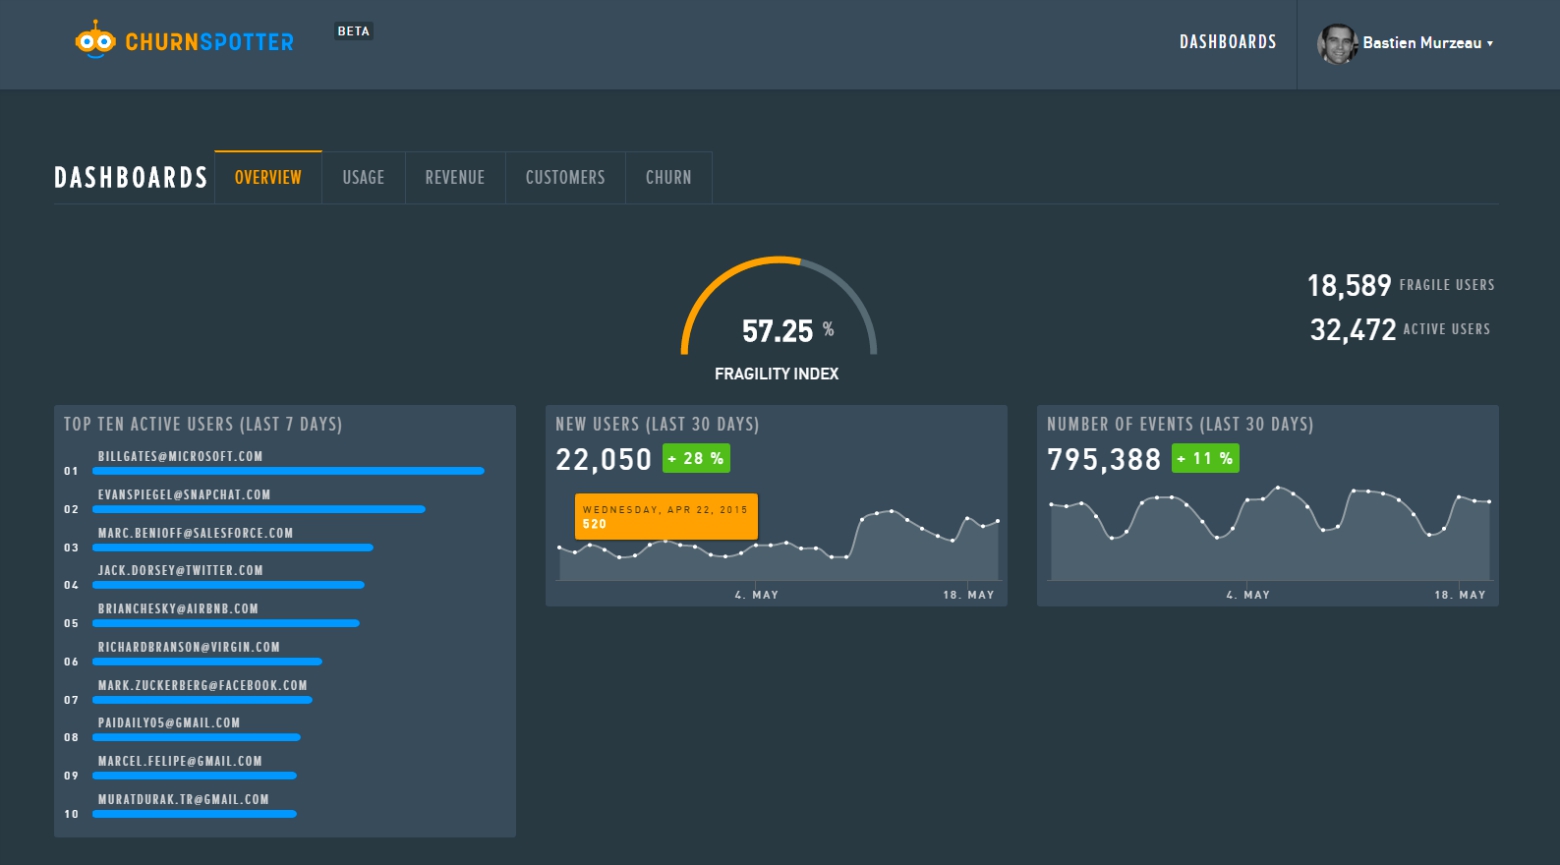
Even professionally designed infographics come out like the one above, or on the other extreme, professionals present data in the traditional, ugly form that is uninspiring, as below:

You can do better
The two images above are embarrassing for professionals as the information is convoluted or lost in a sea of bad design. Companies typically rely on their in-house or third party designers to create visualizations for them, and are now commissioning them for their own website and blog in a rising number, presenting information to the public about their inner workings, but also for internal use so that information is visually presented, simplified, and easy to overview.
Enter Picktochart.com, the infographic app that allows users to select a theme for their infographic, edit information and customize, then save to various formats. If you are capable of editing a PowerPoint presentation, you will master Picktochart.
In about 10 minutes, we created this infographic below through Piktochart (the information is fictional and is just a sample):
It’s not all about social media though, you can present a variety of information visually. Below are the 24 Picktochart themes, and the company says they will be adding more over time:

Piktochart does not require contracts or setup fees and has a free version which offers 3 themes, a $9.99/mo PRO version that offers 15 themes and customization, and an Annual Pro account for $99/year. It appears these prices are a launch special that ends this month, but compared to commissioning a professional infographic (which is notably more desirable), this is a good alternative for small businesses on a budget.
Alternative infographic makers
While Piktochart is an inexpensive, easy to use option, there are others on the market worth checking out.
- Piktochart – Transforms your information into memorable presentations.
- Infogr.am – Create interactive charts and infographics.
- Gephi – Like Photoshop for data. Graph visualization and manipulation software.
- Tableau Public – Free data visualization software.
- Free Vector Infographic Kit – Vector infographic elements from MediaLoot.
- easel.ly – Create infographics online.
- Weave – Web-based analysis and visualization environment.
- iCharts – Charts made easy.
- ChartsBin – A web-based data visualization tool.
- GeoCommons – See your data on a map.
- Prefuse – Information visualization software.
- StatSilk – Desktop and online software for mapping and visualization.
- Gliffy – Online diagram and flowchart software.
- Hohli – Online charts builder.
- Many Eyes – Lets you upload data and create visualizations.
- Google Chart Tools – Display live data on your site.
UPDATE: if you’re looking for hilarious inspiration or want a good laugh based on a Piktochart created by a busy professional, Kris Berg’s San Diego Home Blog has a great example for your perusal.
Marti Trewe reports on business and technology news, chasing his passion for helping entrepreneurs and small businesses to stay well informed in the fast paced 140-character world. Marti rarely sleeps and thrives on reader news tips, especially about startups and big moves in leadership.


abodograph
July 17, 2012 at 4:15 pm
Great, timely story 🙂 I just started using Piktochart yesterday. There are a few rough spots, but it’s a pretty quick way to get an infographic done.
Aron Susman
July 17, 2012 at 4:43 pm
We use this quite a bit and just did an Apple Infographic that scored us a bunch of traffic, all from a few hours on Piktochart
SlinkyAndSnudis
September 16, 2012 at 4:11 pm
I would love to see an example as given above of “Your New Healthcare System” created in PiktoChart, since your blog suggests that the PiktoChart could enhance complex information visualisations. This template-approach doesn’t thrill me to be honest, as a designer I would never use it, it might be good for some simple information to be presented, but after a few people start using it, all their infographics will look the same.
animechart
October 25, 2012 at 6:26 am
@SlinkyAndSnudis Me too. I’d rather use http://www.infogr.am, it’s simple and doesn’t try to make complex stuff that I can do myself.
Pingback: Create charts on-the-go with this simple chart creation tool - AGBeat