


A wild roller coaster ride for home values
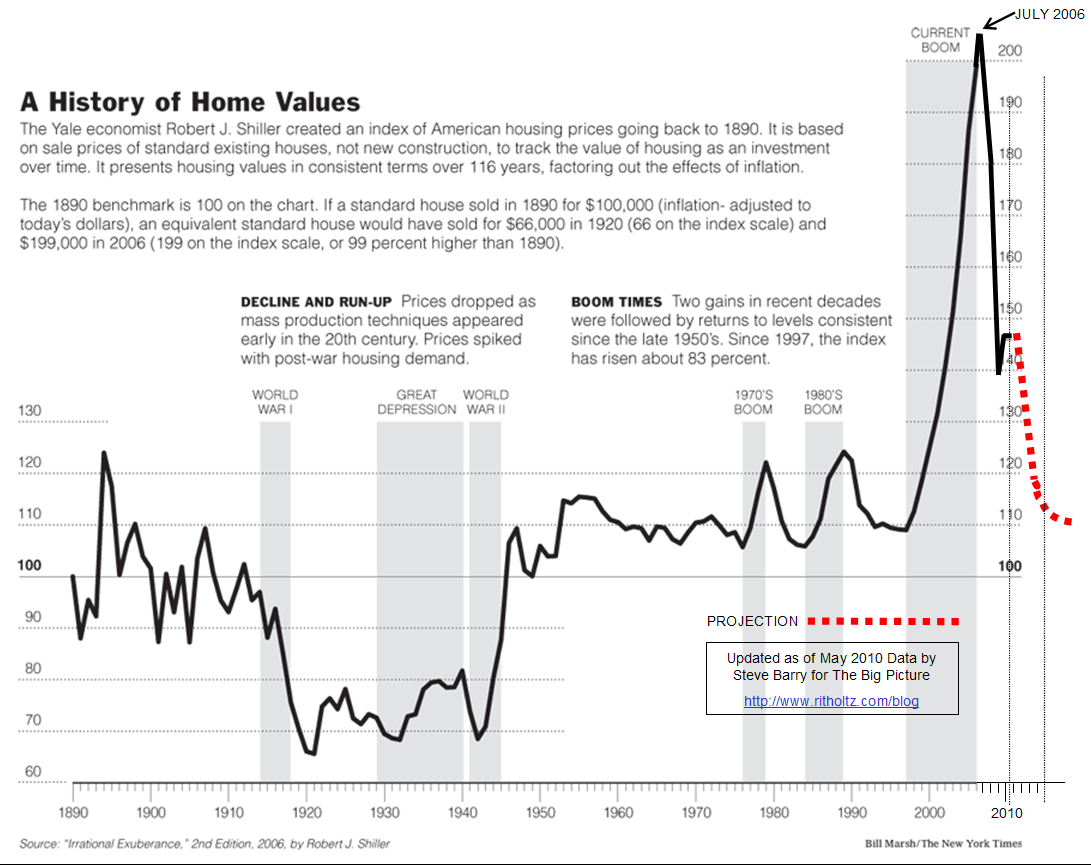
One of the leading indicators in real estate is the long-running Case Shiller data that tracks housing prices in the U.S. Each month, we rely on them as a high quality data source and came across a chart of the last 100 years of home values as published in the New York Times.
Economist Barry Ritholtz said in a recent article, “I asked Steve [Barry of the New York Times] to update [Case] Shiller’s NYT chart, now that much of the government intervention has run its course. There is still massive Federal Reserve subsidies in the form of record low rates. But the short term bounce caused by HAMP, Foreclosure abatements and first time home buyers tax credits are mostly over.”
In the graph below, pay close attention to the dips and how big the most recent boom was (which makes a recession even that much more obvious in retrospect, right?).
Click the image to enlarge.


Property Marbella
August 1, 2010 at 10:52 am
I don´t think it going down more, Obamas tax Credit and other thing for help the market did stop the house prices to fall more.
Ken Montville
August 1, 2010 at 11:38 am
O,,,,M….G. If the projection is anywhere near true, we’re in for a rude awakening. A precipitous decline as foreseen by this graph will certainly cause the “double dip” recession for the economy as a whole and, possibly, create some serious political unrest that would make the gun totin’ Tea Partiers look like an afternoon picnic.
SedonaKathy
August 1, 2010 at 12:40 pm
I hope this extrapolation is wrong, but… I just listened to Greenspan, Bloomberg, and Rundell this AM talking about 2011 being another 2010.
Al Lorenz
August 2, 2010 at 2:15 pm
There’s food for thought! As much as we want to crawl out of the bunker…
Jonathan Benya
August 2, 2010 at 3:24 pm
Wow, thanks for sharing. this is the first time I’ve seen inflation factored out, and from the looks of this chart, we could be in for a much longer, bumpier ride here.
Jonathan Benya
August 2, 2010 at 3:25 pm
So I just noticed the super spiffy gold star next to my name! What does that indicate?
Lani Rosales
August 3, 2010 at 11:54 am
We’re testing out a new feature that highlights people like you who frequently comment 🙂 Ta da!
Michael Goodfellow
August 3, 2010 at 10:13 am
If the tax cuts expire this will seriously affect the already depressed real estate market since the cap gain will increase to 20%. Maryland adds an additional 7.5% tax which raises the overall rate to 27.5%.
Nick Nymark
August 5, 2010 at 7:44 pm
Looks like there has been a pretty big dip…hopefully we don’t dip down any further.
Cody Moghani
August 6, 2010 at 8:49 pm
Dear Tara
Thank you for sharing this great graph. Amazing!! Would you let me know the reasons for peaks and valleys or fluctuations though some of them are minor on the graph. Were due to socio-economic/Politics/historical events or something else? I appreciate you reply.
Cody Moghani