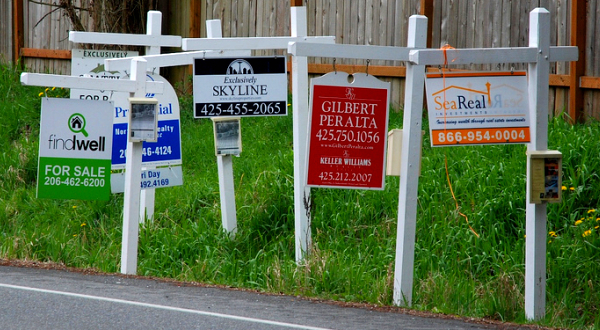
Seattle real estate signs, photo by AR McLin.
Existing home sales slump
Pointing to cancellations of pending contracts as the current depressor of existing home sales, the National Association of Realtors reports today that sales dropped 3.5% in July.
Compared to July 2010, sales have dropped 21% with the primary cause echoing last month’s challenge of “cancellations caused largely by declined mortgage applications or failures in loan underwriting from appraised values coming in below the negotiated price,” NAR said.
Economists polled by Reuters prior to the news today had anticipated sales to rise 3.8% after June sales performed better than expected.
The national median price for existing homes fell 4.4% from July 2010 to $174,000 and distressed homes accounted for nearly a third of all sales in July.
Homes under $100,000 rose 24.6% in sales volume nationally while higher price ranges dropped a bit.
Regional home sales vary
Regionally, performance varied. In the Northeast, sales rose 2.7% in July, propped up by a 32.5 percent increase in the $100-250K range, while homes over $1M declined 8.4 percent in sales volume.
The Midwest only rose one percent in July, but a big win for the region is that no price range dropped and the $100-250K range actually rose 37%.
The South saw a 1.6 percent drop in July and while the $100-250K range is up 18% in sales volume.
The hardest hit area currently is the West region where home sales dropped 12.6% in July. Sales in the $0-100K range skyrocketed 59.7% while higher range prices dropped, so this region is seeing lower sales volume at lower prices.
July metro area existing single family homes
Sales and prices, seasonally adjusted:

Why buyers are held back despite affordability
Dr. Lawrence Yun, NAR chief economist, said there is a tug and pull on the market. “Affordability conditions this year have been the most favorable on record dating back to 1970, but many buyers are being held back because banks are offering financing to only the most highly qualified borrowers, ignoring a large share of otherwise creditworthy buyers,” he said.
“Those potential buyers represent the difference between an uneven recovery and a much more robust housing market that could stimulate additional economic activity and create jobs.”
Tara Steele is the News Director at The American Genius, covering entrepreneur, real estate, technology news and everything in between. If you'd like to reach Tara with a question, comment, press release or hot news tip, simply click the link below.


Augusta Real Estate
August 18, 2011 at 2:02 pm
Wow those are some pretty scary numbers. One reason for the higher 2010 home sale numbers was the $8000 tax incentive. I remember reading a number of blog articles were the commenter's couldn't wait to get rid of the tax incentive. Never could understand why that was. The tax incentive didn't put a bigger burden on tax payers, those dollars were already appropriated through the $800 Billion Dollar Spedulus Plan. Be Encouraged, this will turn around!!!
Jboy
August 18, 2011 at 3:41 pm
I agree with Augusta Real Estate, pretty scary numbers. If you look at the historical trend regarding prices of homes and annual household earnings the disparity becomes much more visible. The "housing bubble" began in the ninety's and steadily increased from that point on driving the prices of homes to an abnormally inflated number. In the past prices of homes typically trends with annual household income, as it should. Only in the late ninety's and two-thousands did the disparity become obvious. Thankfully, the two trending numbers are much closer now, than than they have been in the past five years. There still may be a marginal decrease in value before we see a true turn-around.
Manley Realty
October 11, 2015 at 1:54 pm
The numbers look way off.
Lani Rosales
October 17, 2015 at 8:29 pm
This story is from 2011, so they’re accurate for that time, but you’re right, for today, they’re off 🙂