


Numbers are now sexy
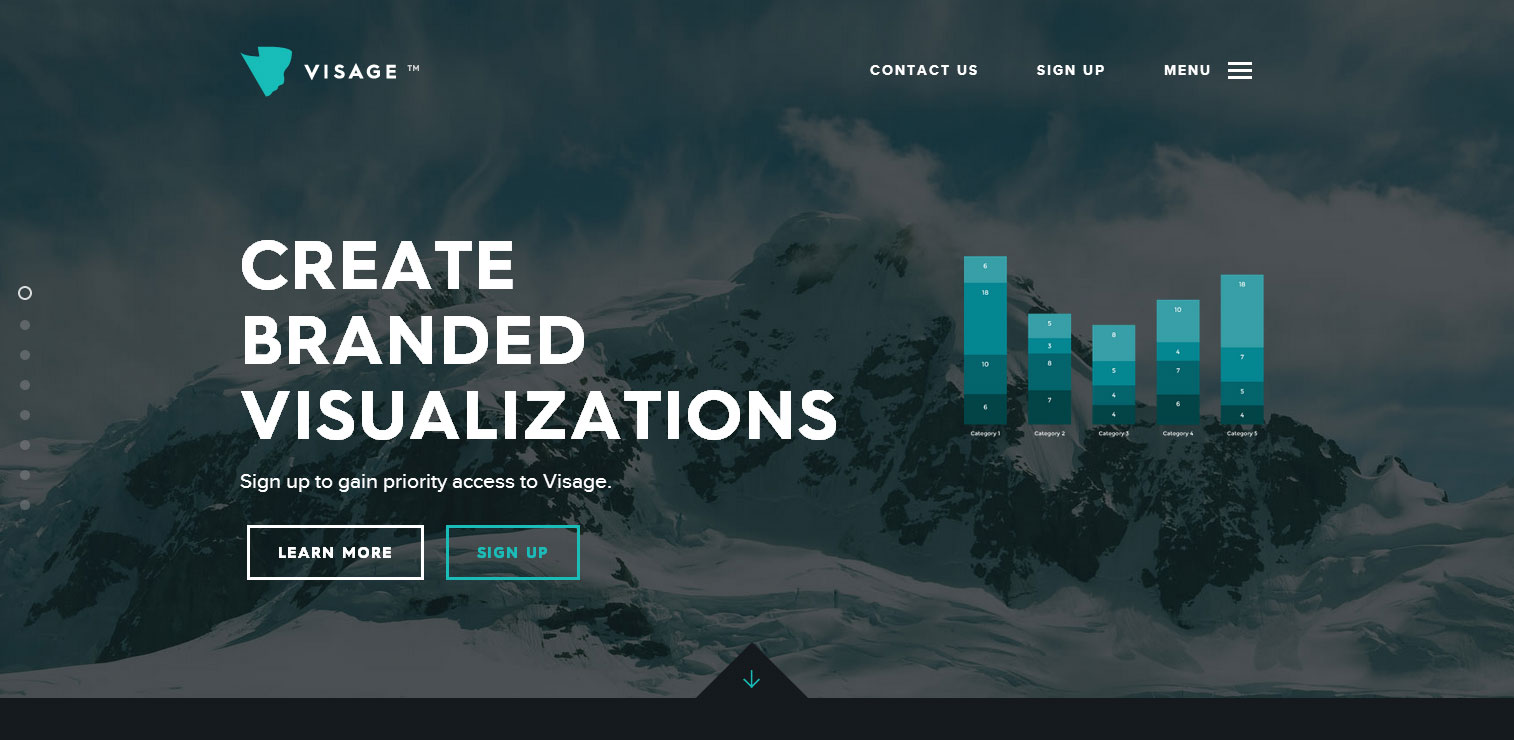
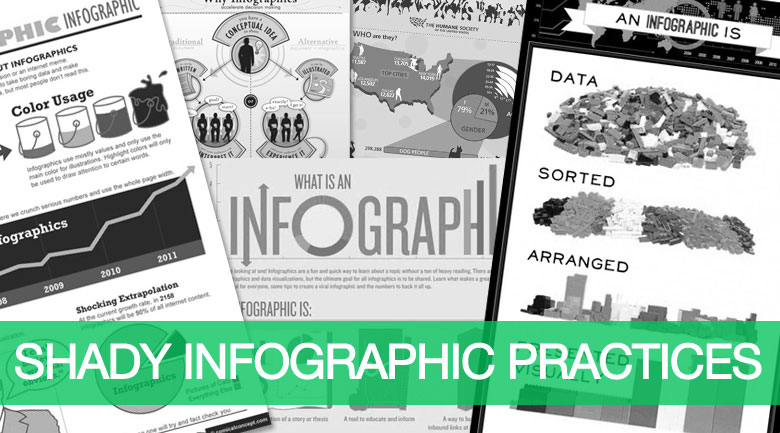
Nerds of the world, rejoice, numbers are officially sexy. Infographics (information graphics) have existed for some time but are now going mainstream, so much so that we feature a new infographic almost every day now. It is a sexy way to present data that may be dry or complicated and present it in a modern, aesthetically pleasing way.
But it’s not just economists that are in on the game, real estate has flocked to data visualization to reveal trends with Trulia leading the charge having launched a website specifically for their interactive infographics with their massively respected in-house talent that has already impressed the world with various heat maps and data visualizations.
Cultural implications of infographics
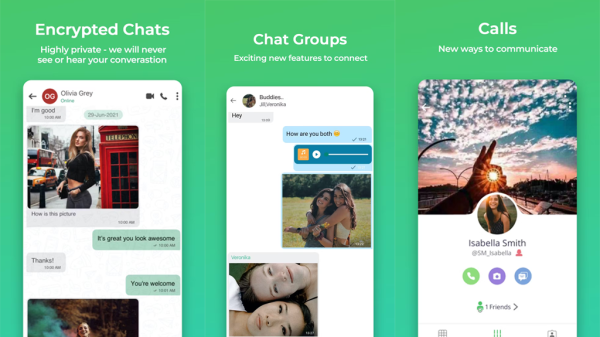
The cultural implications of infographics are huge and it’s so much more than a chart people share on Twitter, it represents a shift toward streamlined design and interactive data. But it’s not just sexy numbers that are being presented in a very simplistic anti-1996-geocities-links-and-icons-everywhere way, Apple design for the last decade has lead the charge in taking the complicated and turning it into duh simple.
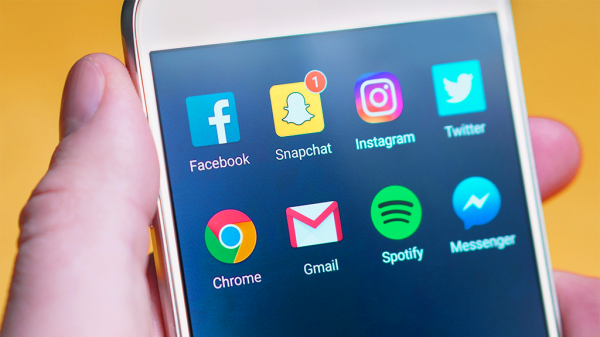
Graphic design in logos are more minimalistic, websites, smartphones and technologies are as well. It appeals to the multi-tasking use emerging in all generations of the people watching tv while listening to music on headphones, texting and typing on their laptop or tablet. It appeals to the shorter attention span in a world of (as Daft Punk said) technology pushing harder, better, faster and stronger and information thirsty consumers. How many of you know a ridiculous amount of trivia from web interactions than you ever would have without the web? Exactly.
The future of all of these elements combined
The above video outlines Microsoft’s vision for applying these streamlined, minimalistic and data intensive visualizations into real life, representing a hyper-intense version of current technologies. Microsoft isn’t promising hovercrafts like the Jestons did, these are all technologies that could theoretically exist in the market very soon but would obviously be cost prohibitive at first until a decade or so from now where we’re using flexible Harry-Potter-esque newspapers to get our daily information and communicating on smartphones that function as little computers (sound familiar?) with rapid speed and fully integrated into our desks and walls.
The future of data visualization goes hand in hand with the future of design and technology and Microsoft projects what our 2019 could look like and it seems feasible based on current technologies. What do you think of the video? What do you like or dislike?
The American Genius is news, insights, tools, and inspiration for business owners and professionals. AG condenses information on technology, business, social media, startups, economics and more, so you don’t have to.