


It’s political season, y’all
With the political debate still on our minds and the election looming, it seems like an appropriate time for a new study about politics. Not politics as such, but rather how housing preferences differ among homeowners based on their political beliefs.
What the study examined
Historically, there are states whose residents predominantly vote for the Democratic Party or the Republican Party. NAR used results from the past six presidential elections to determine Blue (Democratic) and Red (Republican) statuses.
![]()
The study also examined if homeowners in those states had more in common than just their political preferences. For example, do homeowners in Red states own their homes longer than those in Blue?
To answer this question, you can see a visual representation of each state on the map below. By clicking on a state, you’ll be able to see all the relevant information for the year selected. You can see demographic data from 2005 to 2015:
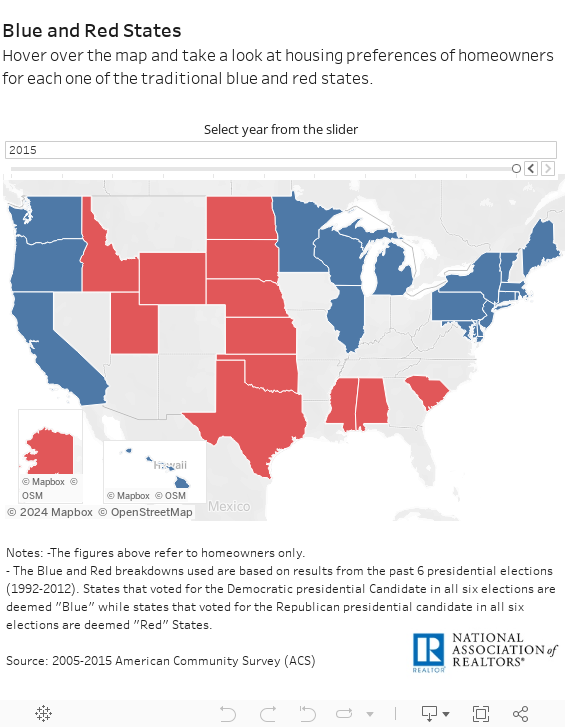
Democratic States
The NAR investigated seven additional areas: median home value, household income and size, how many years they’ve owned their home, the year the home was built, number of rooms, and how the home was heated. Homeowners in the Blue states saw the biggest difference in median income.
Of course, this could be due to the fact that the majority of these Blue states are coastal states with a higher cost of living. The highest value for the Blue states was $566,900 (Hawaii), whereas the lowest was $137,500 (Michigan). This leaves quite a gap in median home value.
Republican States
The Red states saw a much different median home value. The highest value of a home in the Red states was $259,600 (Alaska), whereas the lowest was $112,700 (Mississippi). While there is still quite a bit of difference here, it’s not as large a deficit as it was in the Blue states. Also, Red states had a significantly lower median income: $68,253 versus the Blue states’ $80,718.
However, the median homeownership rate (for non-millennials) remained fairly close: 67.4 percent in Red states and 65.3 percent in Blue states.
Millennial homeownership
While this doesn’t seem to be too large of a gap, the homeownership figures for millennials is another story entirely. When you hover on a state, it tells you the homeownership rate, and also the homeownership rate for millennials. Surprisingly millennial homeownership is high in many states, especially Red states.
[clickToTweet tweet=”Homeownership for millennials in Red states is over 40% – in many states it’s closer to 50%.” quote=”Except for Texas and Alaska, homeownership for millennials in Red states is over 40 percent, and in many cases it’s closer to 50 percent.”]
This is pretty interesting given in the Blue states millennial homeownership ranges from a little over 21 percent in Hawaii to 51 percent in Minnesota.
What this data tells us is that while political differences may fervently divide us, we are all facing the same struggles, especially when it comes to housing. We all face the same challenge of finding an affordable home and keeping it in our possession to enjoy.
#redVblue