


As we continue into 2023, we continue to learn from the past. National statistics from 2022 continue to roll in and we can see what’s changed from 2021 as well as see what trends are predicted for this year.
Such statistics exist in the form of where people moved in 2022. Stats courtesy of the U.S. Census Bureau, analyzed by the National Association of Realtors (NAR) allow us to see what the future of homeownership looks like by location.
People were flocking to Florida and Texas as others fled from California, New York and Illinois.
However, California remains the state with the largest populations at 39 million residents.
Fully 26 states saw their population increase, as 25 states (including the District of Columbia) saw a decrease.
Despite the national population continuing to increase, fewer Americans moved in 2022 than in years past.
The year 2021 proved a historically low year for out-of-state moves, likely attributable to the pandemic’s rapid adoption of remote-friendly work policies impacting employees moving to less-expensive areas.
The Census Bureau hasn’t released the moving rate for 2022, but the United States Postal Service’s change-of-address data shows that there was again a decline in migration trend. Nearly 70 percent of ZIP codes across the U.S. experienced fewer inbound moves in 2022 versus 2021.
AN OVERALL VIEW
The following is a list of states sorted by increase in population. The first number is the state’s Domestic Net Migration, and the percentage shows the population change between 2022 and 2021.
Florida: 318,855 / 1.9%
Texas: 230,961 / 1.6%
North Carolina: 99,796 / 1.3%
South Carolina: 84,030 / 1.7 %
Tennessee: 81,646 / 1,2%
Georgia: 81,406 / 1.2%
Arizona: 70,984 / 1.3%
Idaho: 28,639 / 1.8%
Alabama: 28,609 / 0.5%
Oklahoma: 26,791 / 0.7%
Nevada: 20,781 / 1%
Arkansas: 18,209 / 0.6%
Montana: 16,003 / 1.5%
Utah: 12,898 / 1.2%
Delaware: 11,826 / 1.4%
Maine: 11,600 / 0.6%
Kentucky: 10,420 / 0.1%
South Dakota: 8,424 / 1.5%
Wisconsin: 7,657 / 0.2%
New Hampshire: 6,303 / 0.6%
Colorado: 5,376 / 0.5%
Indiana: 5,230 / 0.3%
Missouri: 5,024 / 0.1%
Wyoming: 2,152 / 0.3%
Vermont: 1,141 / 0%
West Virginia: 474 / -0.6%
North Dakota: -2,710 / 0.2%
Washington: -3,580 / 0.6%
District of Columbia: -3,647 / 0.5%
Nebraska: -4,270 / 0.2%
New Mexico: -4,504 / -0.2%
Rhode Island: -5,196 / -0.3%
Mississippi: -5,716 / -0.3%
Alaska: -6,126 / -0.1%
Iowa: -7,292 / 0.1%
Kansas: -7,409 / 0%
Michigan: -8,482 / 0%
Ohio: -9,165 / -0.1%
Connecticut: -13,547 / 0.1%
Hawaii: -15,212 / -0.5%
Oregon: -17,331 / -0.4%
Minnesota: -19,400 / 0.1%
Virginia: -23,952 / 0.3%
Pennsylvania: -39,957 / -0.3%
Maryland: -45,101 / -0.2%
Louisiana: -46,672 / -0.8%
Massachusetts: -57,292 / -0.1%
New Jersey: -64,231 / -0.1%
Illinois: -141,656 / -0.8%
New York: -299,557 / -0.9%
California: -343,230 / -0.3%
LOOKING AT LARGE METRO AREAS
When looking at the DNM by metro area, Ocala and Tallahassee in Florida saw an influx, as did Charlotte, NC, Savannah, GA, Houston, TX, Deltona, FL, and Myrtle Beach, SC. Many of these populous areas are not only located in the Sun Belt region, but also saw a hearty job market recovery post-pandemic.
The following shows the Inbound Move Rate for large metro areas in 2022, 2021, and 2019.
Boston-Cambridge-Quincy, MA-NH MSA (50.1%; 50%; 58%)
Chicago-Naperville-Joliet, IL-IN-WI MSA (49.5%; 50.4%; 56.7%)
Los Angeles-Long Beach-Santa Ana, CA MSA (51.5%; 52.3%; 56.7%)
New York-Northern New Jersey-Long Island, NY-NJ MSA (49.4%; 49.1%; 59.5%)
San Jose-Sunnyvale-Santa Clara, CA MSA (51%; 50.1%; 55%)
Washington-Arlington-Alexandria, DC-VA-MD-WV MSA (53.4%; 54.3%; 63.3%)
The areas that saw the largest inbound move rates were: Ocala, FL (57.1%); Tallahassee, FL (56.6%); Savannah, GA (55.8%); Houston, TX (55.7%); Deltona, FL (55.7%); Myrtle Beach, SC (55.6%); Huntsville, AL (55.4%); Miami, FL (55.2%); McAllen, TX (55.1%). These reflect areas with more than 150,000 households.
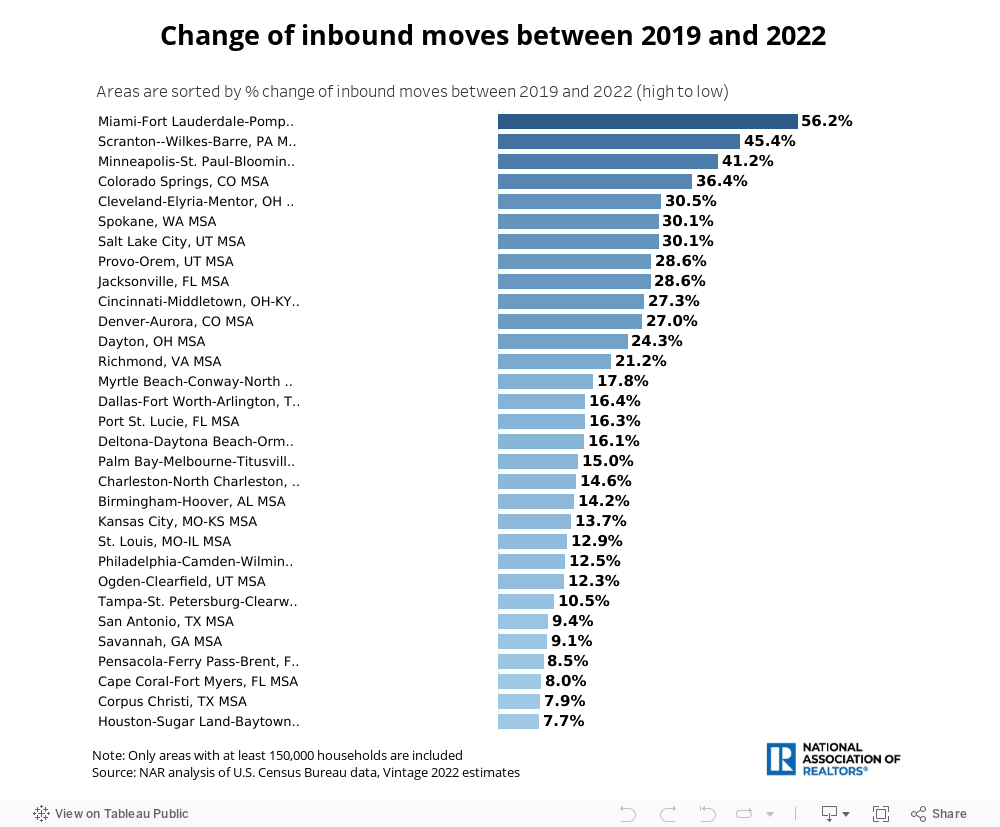
INBOUND MOVES CHANGE
See the graph below which reflects the change of inbound moves between 2019 and 2022, courtesy of the NAR:
So, with all of this, the question becomes: what is different now than it was before the pandemic?
The Census Bureau found that 46 percent of the moves made in 2021 were for housing-related reasons, which is a six percent increase from the year before. One could surmise that these movers were searching for specific and better neighborhoods, cheaper housing, and/or a newer/larger home.