


It’s a pretty good time to sell a home.
With historic lows in inventory driving up prices in many markets, sellers are typically getting 99% of asking price and selling within 3 weeks, according to the numbers in the National Association of Realtors’ “2020 Profile of Home Buyers and Sellers.”
Also, people 54 and younger tended to trade up to larger, more expensive homes and were the most active sellers. Older people were more likely to downsize to smaller, less expensive homes.
While this latest edition of NAR’s annual report focuses on sellers who closed from July, 2019, through June, 2020, NAR added a look at trends related to the start of the COVID-19 pandemic, pulling out data from sellers who closed in April through June, 2020. They found upswings in sellers’ desire for more space and their sense of urgency to sell, as well as changes in how agents are marketing homes. (Trends for buyers also were seen in the demand for more space, including homes suitable for multiple generations.)
Here are some of the main takeaways from the full report.
Typical sellers stayed in their home 10 years.
The median number of years that sellers had been in their homes has held steady at 9 to 10 years since 2011. However, 2020’s most active sellers were age 65 and older and had been in their home for 16 years or longer. The seller short-timers were ages 18 to 34, and they typically sold within 5 years. Looking at property type, owners of detached single-family homes tended to stay the longest (median 11 years), followed by mobile/manufactured homes (median 9 years).
Furthermore, 69% of sellers had sold a home before; 31% were first-timers.
Sellers are getting what they ask for.
Tight inventory is continuing to drive up prices in many areas of the U.S., and homes are tending to sell quickly, typically within 3 weeks. For all sellers, the sales price is typically 99% of the final listing price. It’s even higher in the West at 100%, but some buyers in the South and Midwest are getting 101% to 110% over list.
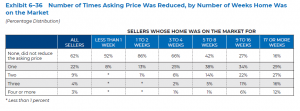
How much of the asking price sellers got started to decline at 3 to 4 weeks, which is also when price reductions started to kick in.
Very few homeowners are delaying selling because they’re underwater.
Home prices are up, so the percentage of sellers facing trying to sell a home that’s worth less than their mortgage has decreased from 7% in 2019 to 6% in 2020. In addition, 10% of sellers who bought 11 to 20 years ago reported waiting to sell in hopes of a more favorable market. This doesn’t seem to be much of an issue for sellers, as 95% said they sold when they wanted to.
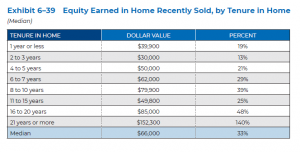
Sellers are making more money on their homes.
Typically $66,000 in equity, to be exact. That’s up from 2019, when the median was $60,000. The price gain went from 31% to 33%. Unsurprisingly, longer tenure meant even more money: 8 to 10 years made $79,900, 11 to 15 years made $49,800, and homes sold after 21 years brought in a whopping $152,300 over the original purchase price.
Sellers tend to be older, have higher incomes, and be part of a married couple.
Some numbers:
- Age: Median is 56. Most-active age groups were 65 to 74 (24%) and 55 to 64 (22%).
- Income: 2019 median was $106,500, up from $102,900 in 2018. Highest incomes were in the Northeast and the West.
- Race/ethnicity: 90% identified as White or Caucasian.
- Household makeup: 71% married couples; 16% single females; 7 % single males; 4 % unmarried couples; 2 % other. 68% have no children under 18.
After the sale, they’re mostly buying nearby.
When it came to location, 70% of sellers stayed in the same state, 16% changed regions, and 14% went for the same region, different state. In fact, 40% of all sellers moved 10 or fewer miles away from their previous home. The median move was 20 miles away for all sellers, but for people age 65 and older it was 40. To add to that, 40% of sellers ages 65 to 74 moved more than 100 miles away. People in the West moved the farthest, with a median of 35 miles away.

Suburbs and the South are hot.
Of all homes sold, 41% were in a suburb or subdivision. Small towns made up 18%, urban areas/central cities had 13%, and rural areas took 15%. Interestingly, 80% of all homes sold were detached, single-family properties.
It’s not just the weather in the South that’s hot. The region accounted for 37% of homes sold or for sale, while the West had 25%, the Midwest had 24%, and the Northeast had 14%.

Nearly half of sellers traded up on space; about a third traded down.
When it came to space, 44% of sellers bought a larger home, 30% kept about the same amount of space, and 30% went smaller. Sellers age 44 and younger grabbed 600 to 700 more square feet. Buyers 55 and older downsized by about 100 square feet. The majority of homes sold had 3 bedrooms and 2 full bathrooms.

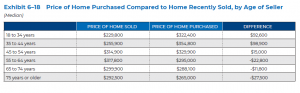
Most sellers bought newer, more expensive homes.
When it came to vintage, 61% of sellers went on to buy a newer home, 26% found an older one, and 21% stayed with the same vintage. For 49% of sellers, trading homes meant paying more, whereas 27% bought a less expensive home, and 23% stayed at the same price point. The group who splashed out the most was ages 35 to 44, who paid $98,900 more than they had paid for the house they sold. Those 55 and older spent between $22,800 and $27,500 less than they had paid.
Being closer to their people and needing more space are the top reasons for selling.
For sellers overall, 15% said they wanted to move closer to friends or family, 14% said their home was too small, and 12% had a change in family situation (divorce, birth of a child, etc.). Another reason cited was job relocation including 11% of sellers, and those were people who moved the greatest distances.
For those who stayed in the same or a nearby neighborhood, the number one reason to sell was that the house was too small, and that includes nearly a third of first-time sellers. Reason number 2 was that the house was too big, including 12% of repeat sellers, although their top reason for selling was to be closer to family and friends (19%).

Sellers understand the benefits of having an agent – and give their agents a good grade.
The percentage of sellers who worked with a real estate agent held steady from 2019 at 89%, a rise from 79% in 2001. But there were some regional differences. Homeowners in the West (92%) and the Northeast (91%) topped this list, whereas the lowest rates were in the South (89%) and the Midwest (88%).
Sellers generally reported being happy with the process: 69% said they were “very satisfied” and 21% marked “somewhat satisfied.” (On the buyers side, agents got higher marks: 76% said they would “definitely” use their agent again, while 15% said “probably.”)
FSBOs are pretty much no go; iBuyers haven’t caught on.
“For sale by owner” transactions stayed below the historic norm at 8% this year, after having been as high as 12% to 14% from 2001 to 2008. For sellers who did go that route, 51% already knew the buyer (compared with 8% of all sellers). iBuyer programs got fewer than 1% of recent sellers’ business.
Homes tended to be on the market for 3 weeks. More than that, and sellers got less.
The median number of weeks on the market for all sellers was 3 weeks, except for the Midwest, which logged 2 weeks. Sellers whose homes took 2 weeks to sell – more than a third of all sellers – typically got 100% of their asking price. For the 29% of sellers who sold in less than a week, they did even better and got more than they asked for.
As usual, the longer a property is on the market, the less sellers got of their asking price. Homes that sat on the market 17 weeks or more typically got the seller 94% of the listing price; only 16% of those homes got the initial asking price.

Notably, 62% of all sellers did not reduce the asking price on homes sold. Reductions typically started to kick in at about 3 to 4 weeks on the market.
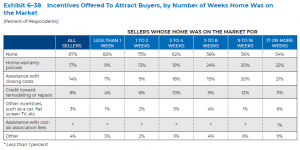
Less than half of sellers offered incentives.
Of all sellers, 67% offered no incentives, and sellers in the Northeast were least likely to try to sweeten the deal. Incentive offers typically started kicking in between 3 and 4 weeks on the market. Home warranties were the most popular incentive (17%), followed by help with closing costs (14%).